NASA Releases New High-Quality, Near Real-Time Air Quality Data
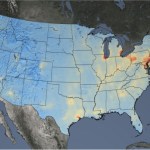
NASA has made new data available that can provide air pollution observations at unprecedented resolutions – down to the scale of individual neighborhoods. The near real-time data comes from the agency’s TEMPO (Tropospheric Emissions: Monitoring of Pollution) instrument, which launched last year to improve life on Earth by revolutionizing the way scientists observe air quality […]
NASA Releases New High-Quality, Near Real-Time Air Quality Data
NASA has made new data available that can provide air pollution observations at unprecedented resolutions – down to the scale of individual neighborhoods. The near real-time data comes from the agency’s TEMPO (Tropospheric Emissions: Monitoring of Pollution) instrument, which launched last year to improve life on Earth by revolutionizing the way scientists observe air quality from space. This new data is available from the Atmospheric Science Data Center at NASA’s Langley Research Center in Hampton, Virginia.
“TEMPO is one of NASA’s Earth observing instruments making giant leaps to improve life on our home planet,” said NASA Administrator Bill Nelson. “NASA and the Biden-Harris Administration are committed to addressing the climate crisis and making climate data more open and available to all. The air we breathe affects everyone, and this new data is revolutionizing the way we track air quality for the benefit of humanity.”
The TEMPO mission gathers hourly daytime scans of the atmosphere over North America from the Atlantic Ocean to the Pacific Coast, and from Mexico City to central Canada. The instrument detects pollution by observing how sunlight is absorbed and scattered by gases and particles in the troposphere, the lowest layer of Earth’s atmosphere.
“All the pollutants that TEMPO is measuring cause health issues,” said Hazem Mahmoud, science lead at NASA Langley’s Atmospheric Science Data Center. “We have more than 500 early adopters using these datasets right away. We expect to see epidemiologists and health experts using this data in the near future. Researchers studying the respiratory system and the impact of these pollutants on people’s health will find TEMPO’s measurements invaluable.”
An early adopter program has allowed policymakers and other air quality stakeholders to understand the capabilities and benefits of TEMPO’s measurements. Since October 2023, the TEMPO calibration and validation team has been working to evaluate and improve TEMPO data products.
We have more than 500 early adopters that will be using these datasets right away.
hazem mahmoud
NASA Data Scientist
“Data gathered by TEMPO will play an important role in the scientific analysis of pollution,” said Xiong Liu, senior physicist at the Smithsonian Astrophysical Observatory and principal investigator for the mission. “For example, we will be able to conduct studies of rush hour pollution, linkages of diseases and health issues to acute exposure of air pollution, how air pollution disproportionately impacts underserved communities, the potential for improved air quality alerts, the effects of lightning on ozone, and the movement of pollution from forest fires and volcanoes.”
Measurements by TEMPO include air pollutants such as nitrogen dioxide, formaldehyde, and ground-level ozone.
“Poor air quality exacerbates pre-existing health issues, which leads to more hospitalizations,” said Jesse Bell, executive director at the University of Nebraska Medical Center’s Water, Climate, and Health Program. Bell is an early adopter of TEMPO’s data.
Bell noted that there is a lack of air quality data in rural areas since monitoring stations are often hundreds of miles apart. There is also an observable disparity in air quality from neighborhood to neighborhood.
“Low-income communities, on average, have poorer air quality than more affluent communities,” said Bell. “For example, we’ve conducted studies and found that in Douglas County, which surrounds Omaha, the eastern side of the county has higher rates of pediatric asthma hospitalizations. When we identify what populations are going to the hospital at a higher rate than others, it’s communities of color and people with indicators of poverty. Data gathered by TEMPO is going to be incredibly important because you can get better spatial and temporal resolution of air quality across places like Douglas County.”
Determining sources of air pollution can be difficult as smoke from wildfires or pollutants from industry and traffic congestion drift on winds. The TEMPO instrument will make it easier to trace the origin of some pollutants.
“The National Park Service is using TEMPO data to gain new insight into emerging air quality issues at parks in southeast New Mexico,” explained National Park Service chemist, Barkley Sive. “Oil and gas emissions from the Permian Basin have affected air quality at Carlsbad Caverns and other parks and their surrounding communities. While pollution control strategies have successfully decreased ozone levels across most of the United States, the data helps us understand degrading air quality in the region.”
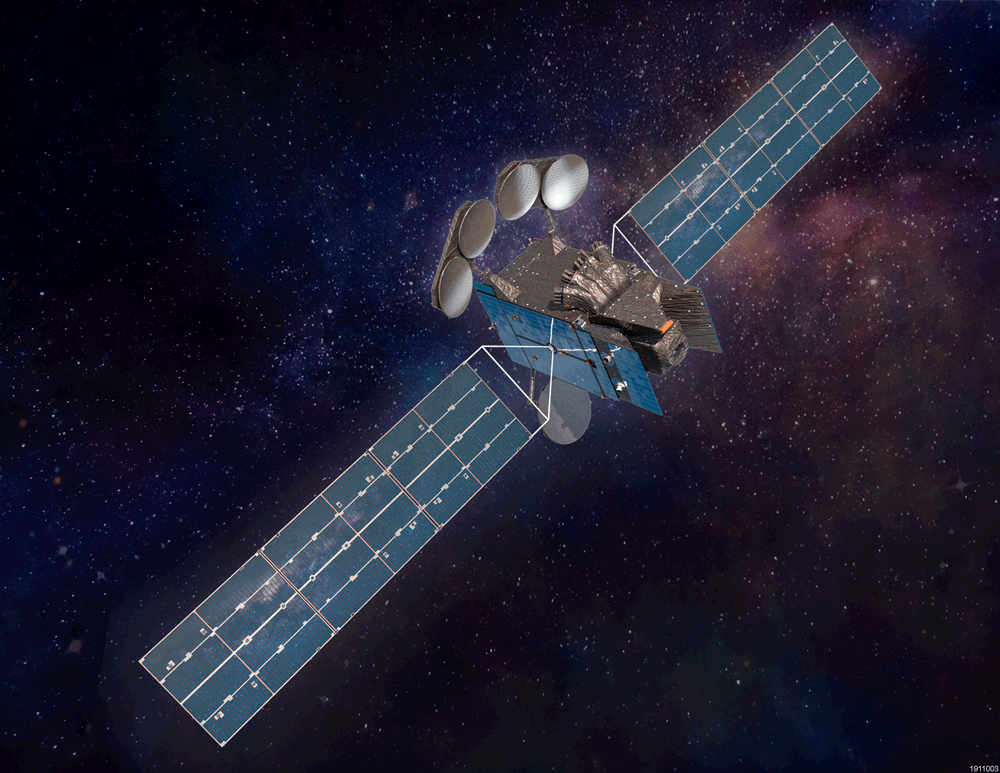
The TEMPO instrument was built by BAE Systems, Inc., Space & Mission Systems (formerly Ball Aerospace) and flies aboard the Intelsat 40e satellite built by Maxar Technologies. The TEMPO Ground System, including the Instrument Operations Center and the Science Data Processing Center, are operated by the Smithsonian Astrophysical Organization, part of the Center for Astrophysics | Harvard & Smithsonian.
To learn more about TEMPO visit: https://nasa.gov/tempo
Share
Details
Related Terms
What's Your Reaction?


