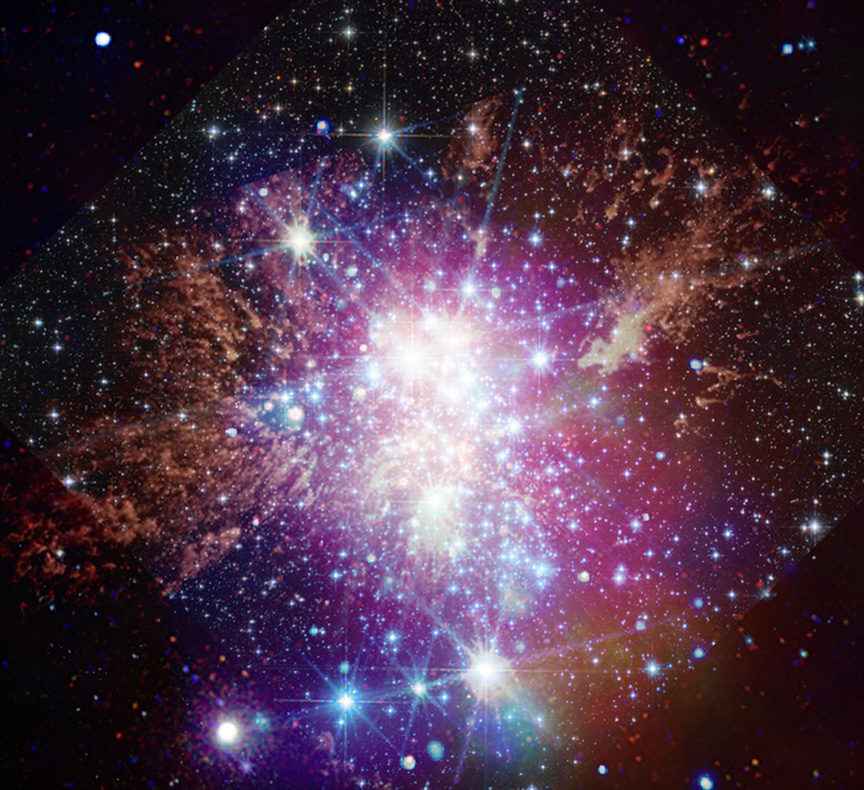


NASA’s Webb Exposes Complex Atmosphere of Starless Super-Jupiter
An international team of researchers has discovered that previously observed variations in brightness of a free-floating planetary-mass object known as SIMP 0136 must be the result of a complex combination of atmospheric factors, and cannot be explained by clouds alone. Using NASA’s James Webb Space Telescope to monitor a broad spectrum of infrared light emitted […]

NASA’s Webb Exposes Complex Atmosphere of Starless Super-Jupiter
NASA, ESA, CSA, and Joseph Olmsted (STScI)
An international team of researchers has discovered that previously observed variations in brightness of a free-floating planetary-mass object known as SIMP 0136 must be the result of a complex combination of atmospheric factors, and cannot be explained by clouds alone.
Using NASA’s James Webb Space Telescope to monitor a broad spectrum of infrared light emitted over two full rotation periods by SIMP 0136, the team was able to detect variations in cloud layers, temperature, and carbon chemistry that were previously hidden from view.
The results provide crucial insight into the three-dimensional complexity of gas giant atmospheres within and beyond our solar system. Detailed characterization of objects like these is essential preparation for direct imaging of exoplanets, planets outside our solar system, with NASA’s Nancy Grace Roman Space Telescope, which is scheduled to begin operations in 2027.
Rapidly Rotating, Free-Floating
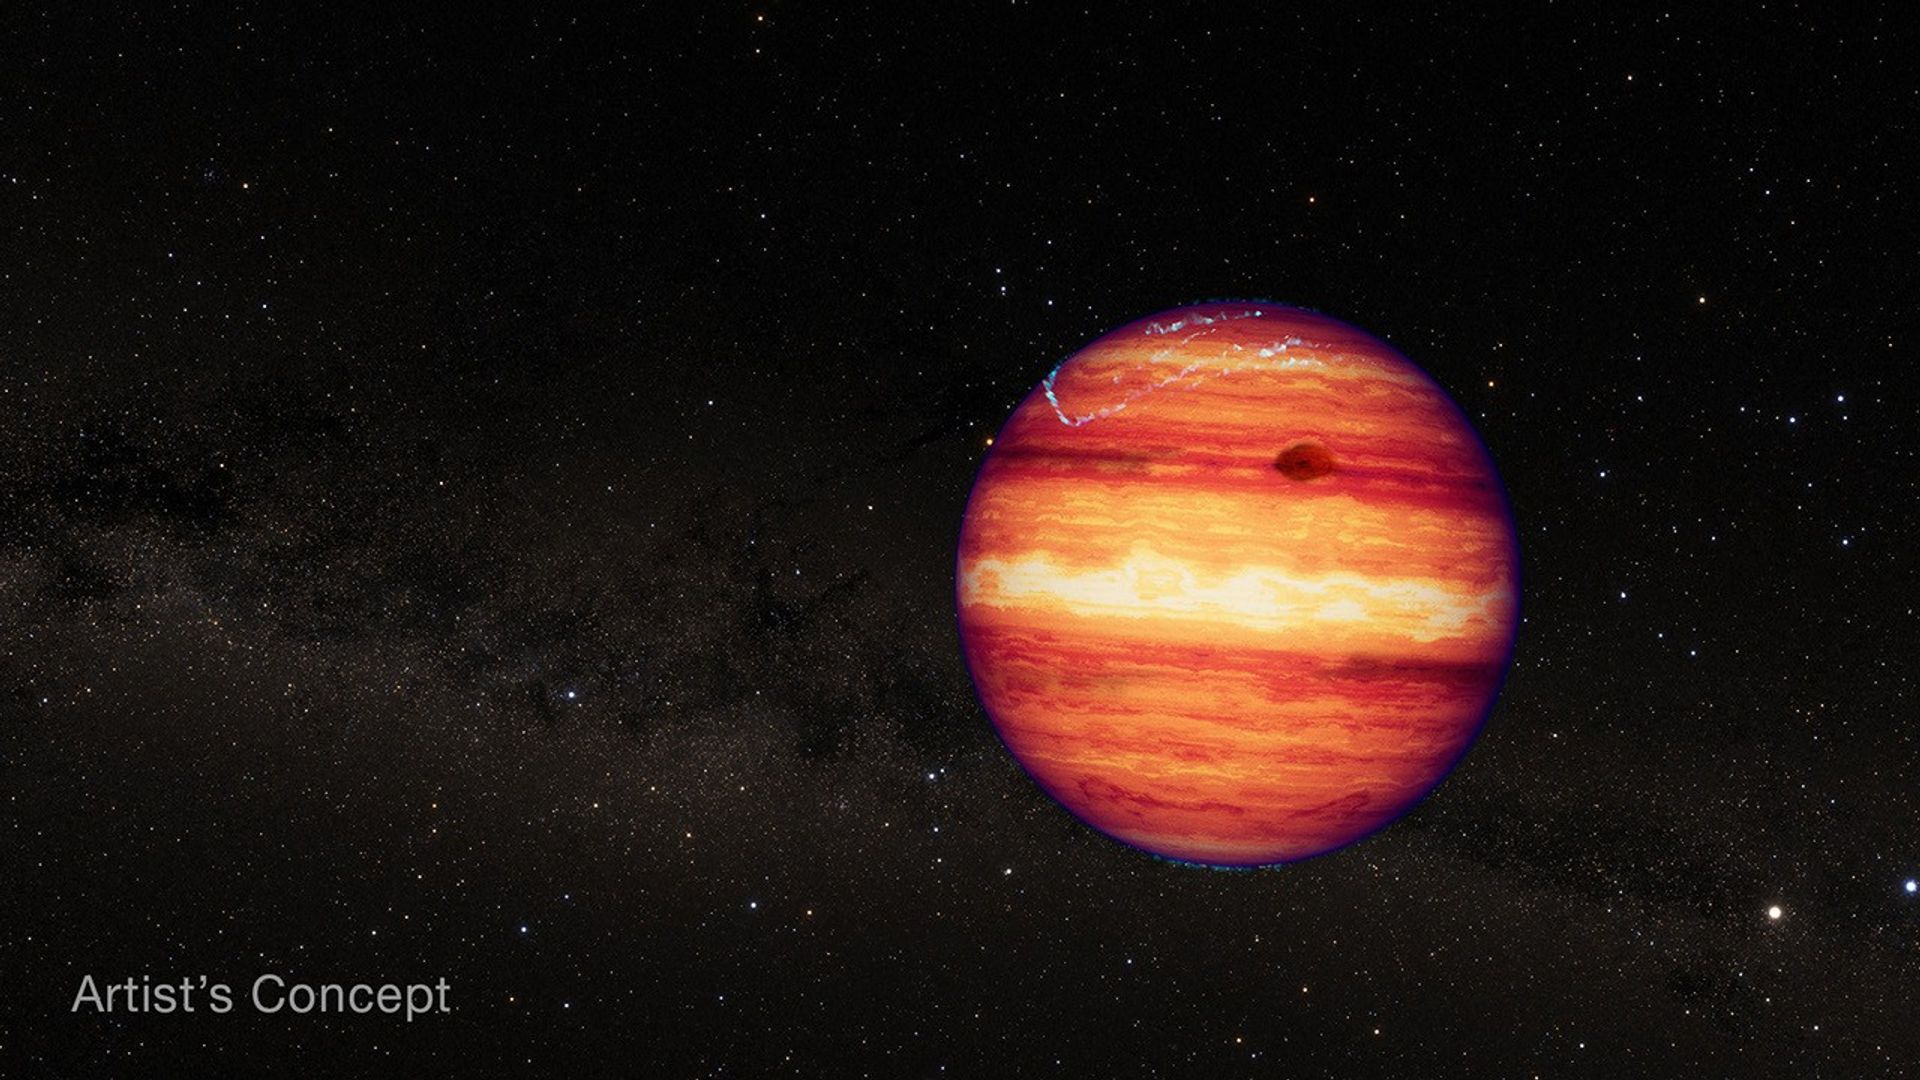
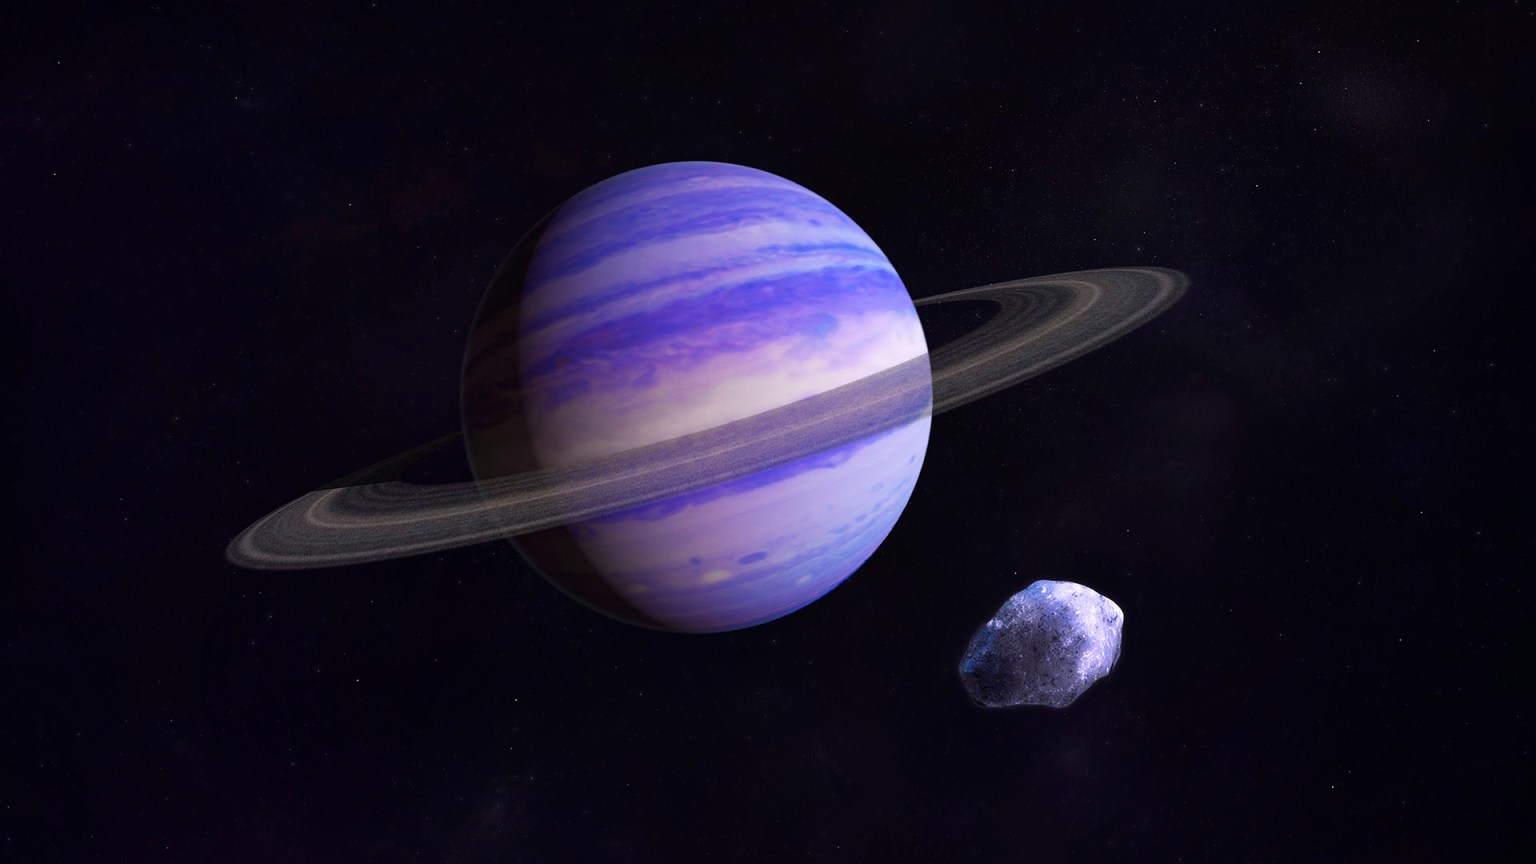
SIMP 0136 is a rapidly rotating, free-floating object roughly 13 times the mass of Jupiter, located in the Milky Way just 20 light-years from Earth. Although it is not classified as a gas giant exoplanet — it doesn’t orbit a star and may instead be a brown dwarf — SIMP 0136 is an ideal target for exo-meteorology: It is the brightest object of its kind in the northern sky. Because it is isolated, it can be observed with no fear of light contamination or variability caused by a host star. And its short rotation period of just 2.4 hours makes it possible to survey very efficiently.
Prior to the Webb observations, SIMP 0136 had been studied extensively using ground-based observatories and NASA’s Hubble and Spitzer space telescopes.
“We already knew that it varies in brightness, and we were confident that there are patchy cloud layers that rotate in and out of view and evolve over time,” explained Allison McCarthy, doctoral student at Boston University and lead author on a study published today in The Astrophysical Journal Letters. “We also thought there could be temperature variations, chemical reactions, and possibly some effects of auroral activity affecting the brightness, but we weren’t sure.”
To figure it out, the team needed Webb’s ability to measure very precise changes in brightness over a broad range of wavelengths.
Graphic A: Isolated Planetary-Mass Object SIMP 0136 (Artist’s Concept)
Charting Thousands of Infrared Rainbows
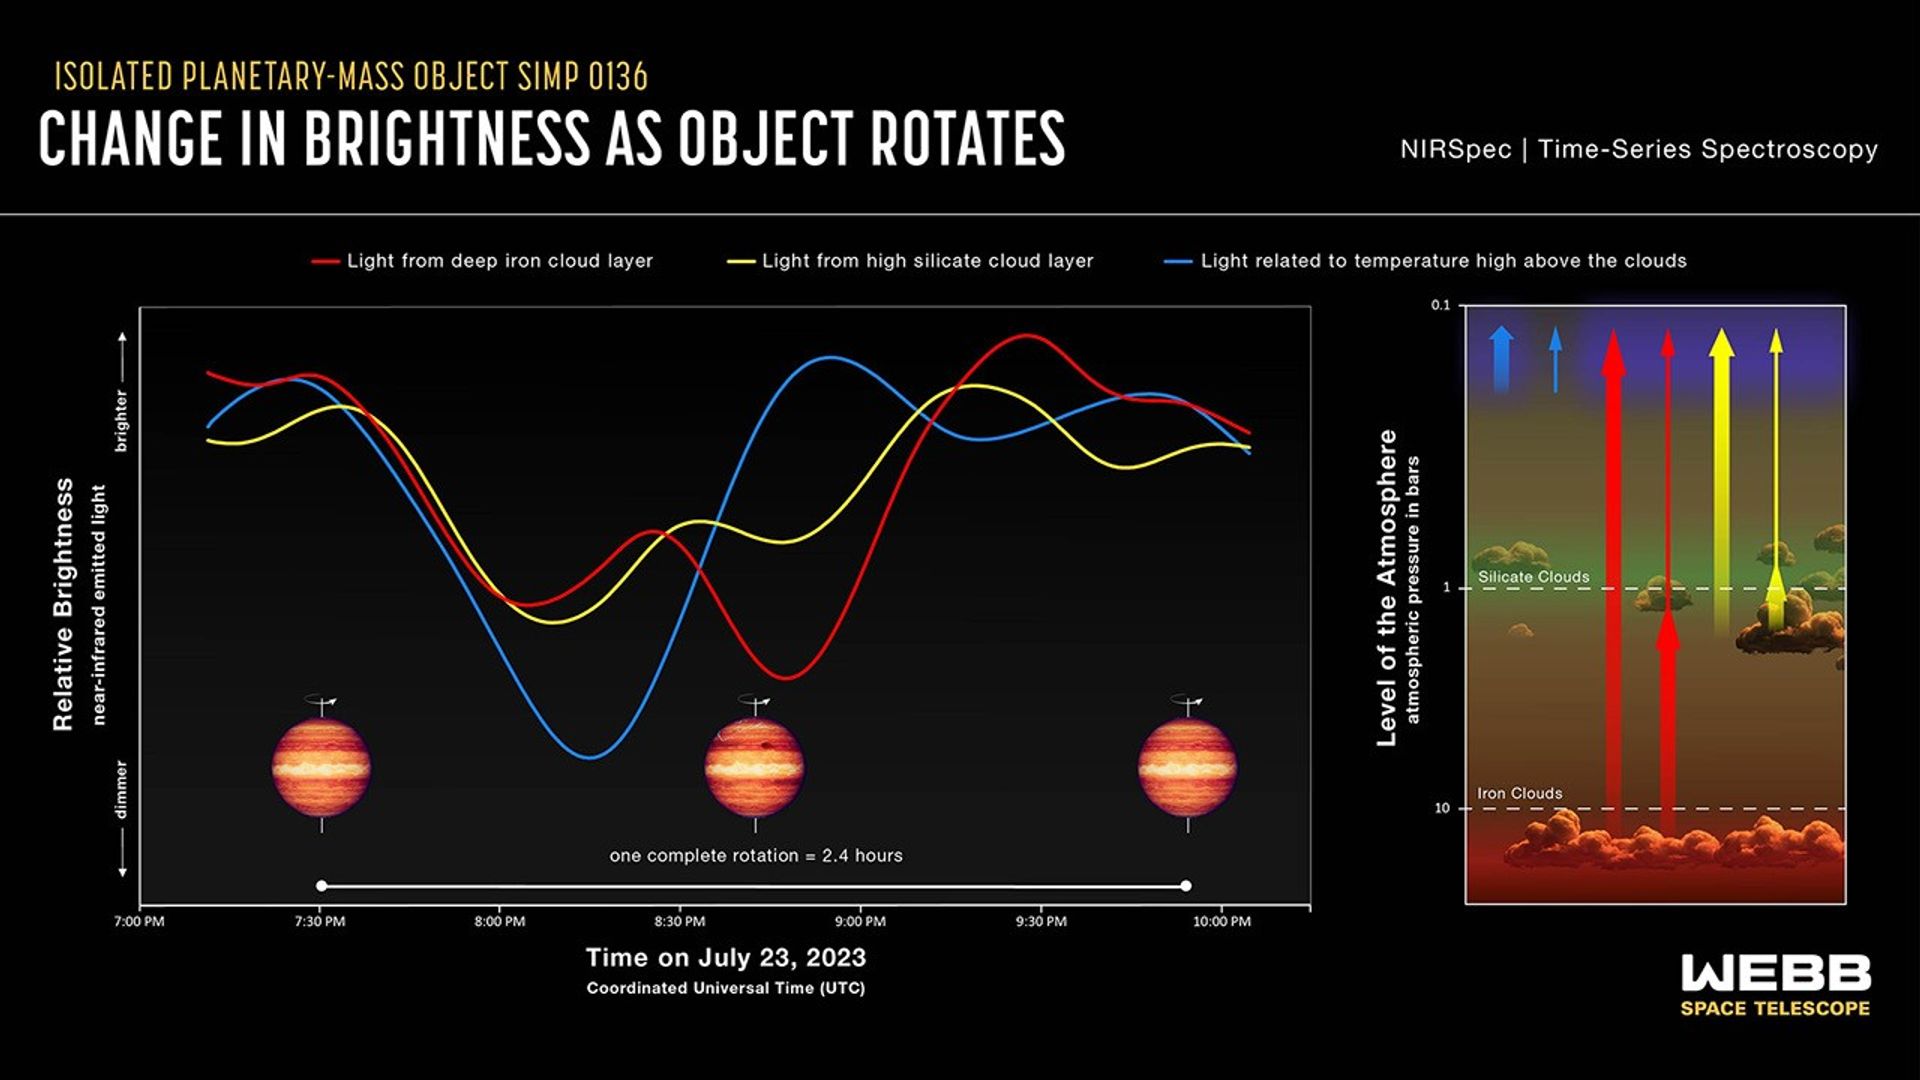
Using NIRSpec (Near-Infrared Spectrograph), Webb captured thousands of individual 0.6- to 5.3-micron spectra — one every 1.8 seconds over more than three hours as the object completed one full rotation. This was immediately followed by an observation with MIRI (Mid-Infrared Instrument), which collected hundreds of spectroscopic measurements of 5- to 14-micron light — one every 19.2 seconds, over another rotation.
The result was hundreds of detailed light curves, each showing the change in brightness of a very precise wavelength (color) as different sides of the object rotated into view.
“To see the full spectrum of this object change over the course of minutes was incredible,” said principal investigator Johanna Vos, from Trinity College Dublin. “Until now, we only had a little slice of the near-infrared spectrum from Hubble, and a few brightness measurements from Spitzer.”
The team noticed almost immediately that there were several distinct light-curve shapes. At any given time, some wavelengths were growing brighter, while others were becoming dimmer or not changing much at all. A number of different factors must be affecting the brightness variations.
“Imagine watching Earth from far away. If you were to look at each color separately, you would see different patterns that tell you something about its surface and atmosphere, even if you couldn’t make out the individual features,” explained co-author Philip Muirhead, also from Boston University. “Blue would increase as oceans rotate into view. Changes in brown and green would tell you something about soil and vegetation.”
Graphic B: Isolated Planetary-Mass Object SIMP 0136 (NIRSpec Light Curves)
Patchy Clouds, Hot Spots, and Carbon Chemistry
To figure out what could be causing the variability on SIMP 0136, the team used atmospheric models to show where in the atmosphere each wavelength of light was originating.
“Different wavelengths provide information about different depths in the atmosphere,” explained McCarthy. “We started to realize that the wavelengths that had the most similar light-curve shapes also probed the same depths, which reinforced this idea that they must be caused by the same mechanism.”
One group of wavelengths, for example, originates deep in the atmosphere where there could be patchy clouds made of iron particles. A second group comes from higher clouds thought to be made of tiny grains of silicate minerals. The variations in both of these light curves are related to patchiness of the cloud layers.
A third group of wavelengths originates at very high altitude, far above the clouds, and seems to track temperature. Bright “hot spots” could be related to auroras that were previously detected at radio wavelengths, or to upwelling of hot gas from deeper in the atmosphere.
Some of the light curves cannot be explained by either clouds or temperature, but instead show variations related to atmospheric carbon chemistry. There could be pockets of carbon monoxide and carbon dioxide rotating in and out of view, or chemical reactions causing the atmosphere to change over time.
“We haven’t really figured out the chemistry part of the puzzle yet,” said Vos. “But these results are really exciting because they are showing us that the abundances of molecules like methane and carbon dioxide could change from place to place and over time. If we are looking at an exoplanet and can get only one measurement, we need to consider that it might not be representative of the entire planet.”
This research was conducted as part of Webb’s General Observer Program 3548.
The James Webb Space Telescope is the world’s premier space science observatory. Webb is solving mysteries in our solar system, looking beyond to distant worlds around other stars, and probing the mysterious structures and origins of our universe and our place in it. Webb is an international program led by NASA with its partners, ESA (European Space Agency) and CSA (Canadian Space Agency).
Downloads
Right click any image to save it or open a larger version in a new tab/window via the browser’s popup menu.
View/Download all image products at all resolutions for this article from the Space Telescope Science Institute.
View/Download the research results from The Astrophysical Journal Letters.
Media Contacts
Laura Betz – laura.e.betz@nasa.gov
NASA’s Goddard Space Flight Center, Greenbelt, Md.
Margaret W. Carruthers – mcarruthers@stsci.edu
Space Telescope Science Institute, Baltimore, Md.
Hannah Braun – hbraun@stsci.edu
Space Telescope Science Institute, Baltimore, Md.
Related Information
Learn more about brown dwarf discoveries
Article: Spectroscopy 101
Related For Kids
En Español

Share
Related Terms
What's Your Reaction?